In 2026, winning a family’s enrollment decision isn’t about having the best test scores. It’s about earning trust before they ever walk through your doors. Districts that understand the parent decision journey — and use enrollment data to act on it — are the ones growing. The rest are reacting.
The Satisfaction Paradox — Why “Good Enough” No Longer Keeps Families
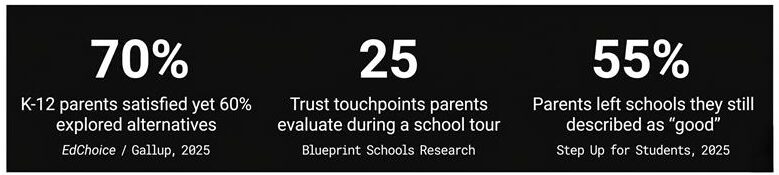
Here’s a data point that should stop every enrollment director cold: 70% of K-12 parents describe themselves as “completely” or “somewhat” satisfied with their child’s school — yet 60% of those same parents actively explored alternatives in the past year.
Even more striking: a 2025 Step Up for Students study found that 55% of parents who received a scholarship to leave their current school still called themselves “somewhat or very satisfied” with the school they were preparing to leave.
This isn’t contradictory behavior. Researchers call it the Satisfaction Paradox — and it’s rewriting how districts need to think about K-12 enrollment management. Families aren’t leaving because they’re unhappy.
They’re leaving because another school made them feel something your district didn’t: deeply trusted.

The research is consistent: trust in educational authorities is among the top predictors of school choice decisions — outranking academic metrics alone in multiple studies. [Taylor & Francis, 2025] For enrollment directors, this means trust isn’t a soft concept. It’s a quantifiable enrollment growth variable — and it can be tracked, managed, and improved.
Introducing the Parent Trust Pyramid for K-12 Enrollment
The Parents 360 Dilemma:
Modern parents are overwhelmed. When choosing a school, they face a “visibility gap.” If your district’s success stories aren’t front-and-center in their digital search, you don’t exist to them.
The Demographic Shift:
Lower fertility rates have fueled a natural decline in the school-age population. We are no longer in a “growth” market; we are in a “market share” market.
Chronic Absenteeism and Disengagement
Since 2020, the rise of homeschooling and alternative education paths has accelerated. Parents are no longer asking which public school to attend; they are asking if they should attend a traditional school at all.
Not all trust is created equal. Parents build confidence in a school progressively — moving through distinct layers from basic awareness to deep community belonging. Understanding where families are in this journey — and using your K-12 enrollment analytics to identify drop-off points — is the key to enrollment growth.
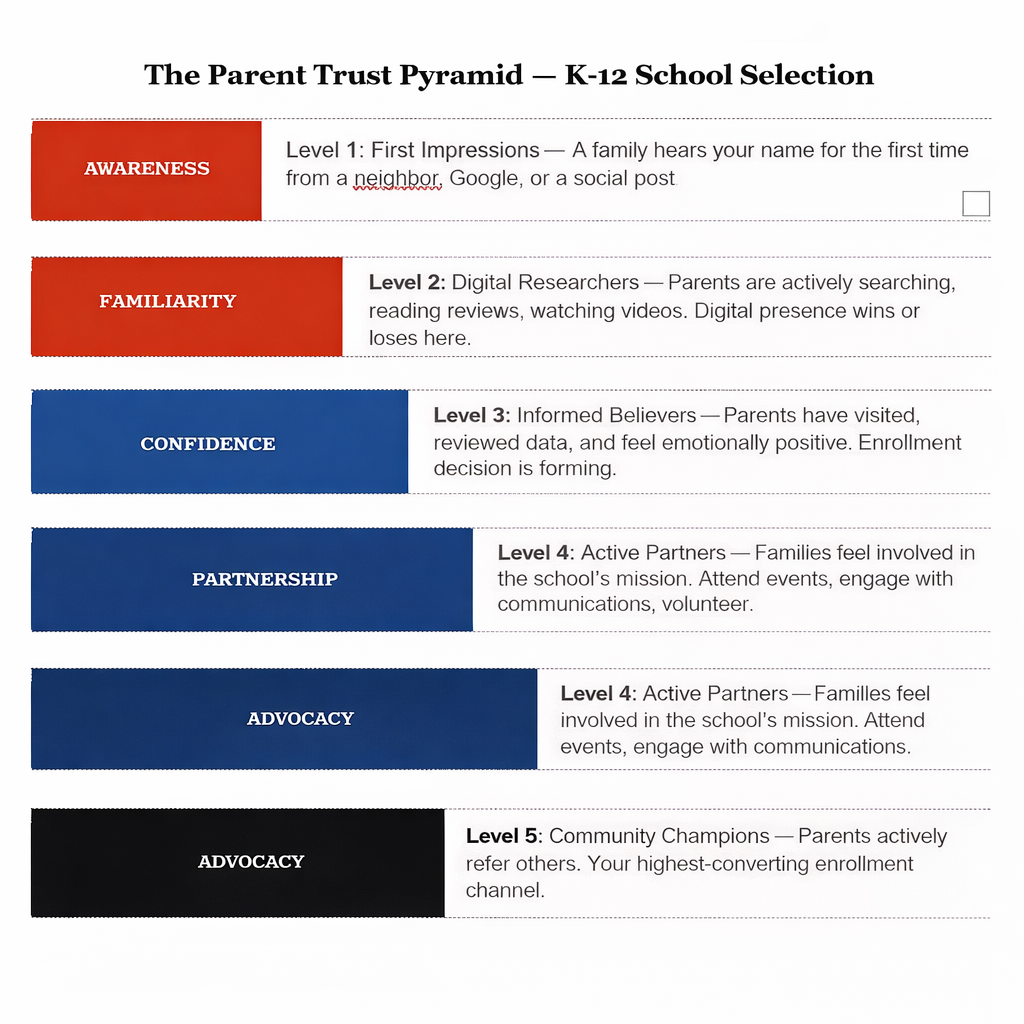
Most districts focus almost all of their K-12 enrollment management effort at Level 3 — the campus tour and open enrollment event. But by that point, a family’s trust decision is already 70% formed. The real enrollment battle happens at Levels 1 and 2, long before anyone schedules a visit.
How to Build Trust at Every Layer — With Data Backing Every Move
To solve the enrollment crisis, school leaders must stop thinking like administrators and start thinking like Chief Growth Officers. The solution lies in the District Enrollment Growth Engine, a framework that transforms raw data into a pipeline of engaged, committed families.
Level 1: Awareness — Control Your First Impression
A family’s first encounter with your district is almost always digital — a Google search, a Nextdoor mention, a Facebook group recommendation. School selection decisions begin 4–6 months before open enrollment opens, in digital spaces your communications team may never see. Research from EdChoice’s 2025 Schooling in America report confirms parents begin evaluating options far earlier than districts typically engage them. [EdChoice, 2025]
At this layer, your K-12 enrollment analytics should be tracking: which zip codes are your awareness gaps? Where are you invisible to families who might otherwise choose you? Enrollment trend analysis for K-12 districts that maps inquiry origins by geography reveals exactly where your brand isn’t showing up — and where your first investment should go.
Level 2: Familiarity — Win the Digital Research Phase
Once aware, parents conduct deep digital research — cross-referencing reviews, scrutinizing websites, joining community Facebook groups, and analyzing social media. McKinsey research confirms that family and friends remain parents’ most trusted sources, while official school communications rank among the least trusted. [McKinsey, 2024] Peer recommendations and authentic community voices consistently outperform institutional messaging at this stage.
This is where student-generated content, parent testimonial videos, and authentic social storytelling do more than any brochure. Your school district enrollment reporting should track digital inquiry volume and source — so you know which content is driving families deeper into the funnel.
Level 3: Confidence — Engineer the Tour Experience
The campus visit is the emotional proving ground of K-12 school selection. AASA research highlights that parents evaluate schools through both rational and deeply emotional lenses — and that the physical environment, staff interactions, and visible school culture are among the most decisive trust signals families encounter. [AASA, 2025] Every touchpoint from the front office greeting to hallway displays answers one overarching question: “Can I trust this school with my child?”
Districts using enrollment data visualization for schools can now show families live dashboards during tours — real-time attendance trends, academic performance by grade, program participation rates. Transparency at this stage converts confidence into commitment.
Level 4: Partnership — Keep Families Engaged After Enrollment
Trust doesn’t end at enrollment. Research in the Journal of Educational Policy and Management consistently finds that a caring school community and genuine family-school partnership are critical drivers of retention. [Research in Educational Policy & Management] Parents who feel like partners — not just recipients of information — become the fuel for Level 5.
This is where your student enrollment KPI dashboard becomes a retention tool. Track mid-year mobility trends, attendance patterns, and early warning signals. Identify families showing disengagement before they submit a transfer request.
Level 5: Advocacy — Turn Satisfied Families Into Your Marketing Team
A structured parent ambassador program is the highest-ROI enrollment growth strategy most districts aren’t running. Word-of-mouth from trusted community members outperforms every paid channel for K-12 enrollment. According to Old Dominion University’s 2025 school choice research, parents rely heavily on social networks and trusted peers when making final enrollment decisions. [Old Dominion University, 2025] Your K-12 enrollment management system should identify your highest-engagement families and activate them as formal ambassadors, tracking referral enrollment as its own KPI.
Why Enrollment Analytics Is the Foundation of Every Trust Level
Here’s what most enrollment directors don’t have: a single live view of everything that matters. Attendance trends. Open enrollment activity. Mid-year transfer patterns. Inquiry-to-application conversion rates. School choice leakage by zip code. Grade-level capacity. These data points exist in your systems — but in most districts, they’re assembled manually, 30 days after the fact.
Modern K-12 enrollment analytics platforms give district leaders a real-time picture of predictive enrollment analytics — generating both district-wide and grade-level forecasts that incorporate open enrollment trends, inter-district transfers, and permit patterns. McKinsey’s K–12 research confirms that districts with real-time data infrastructure make faster, more accurate resource allocation decisions than those relying on static reports. [McKinsey, 2025]
BEST PRACTICE — ENROLLMENT KPI TRACKING
Leading districts track these core student enrollment KPIs in real time: inquiry-to-visit conversion rate, visit-to-application rate, open enrollment yield by feeder school, mid-year transfer-out rate by grade, and referral enrollment percentage. Without these metrics on a live dashboard, enrollment management is reactive by definition.
5 Ways to Apply the Trust Pyramid to Your K-12 Enrollment Strategy
01. Map Your Trust Gap with Enrollment Data Analysis
Pull your last 3 years of K-12 student enrollment tracking data and identify where you’re losing families by zip code, grade level, and transfer destination. This geographic enrollment trend analysis tells you exactly where your awareness and familiarity gaps are — and where to point your marketing budget first.
02. Audit Your Digital Trust Signals
Google your district name and read the first page of results as a prospective parent would. Check your Google Business Profile, review scores, social media recency, and website mobile experience. These are your Level 1 and 2 trust assets — and for most districts, they’re significantly underinvested relative to their enrollment impact.
03. Use School Enrollment Data Analysis to Identify At-Risk Families
Declining attendance, reduced event participation, and lower communication engagement are measurable early signals of families considering alternatives. Your school district enrollment reporting system should flag these patterns automatically — giving your team a window to intervene with personalized outreach before a transfer request arrives.
04. Build a Parent Ambassador Program Tied to Enrollment KPIs
Identify your highest-engagement families from your enrollment data insights for superintendents and build a formal ambassador program. Track referral enrollments as a separate KPI in your student enrollment KPI dashboard. Even a 5% increase in referral enrollment can meaningfully shift your district’s trajectory.
05. Show Families Your Data — Transparently
Districts that share enrollment trends, academic performance data, and program outcomes openly with families build trust faster than those who guard it. Use enrollment data visualization for schools to create parent-facing dashboards or annual transparency reports. Transparency is itself a trust signal — and one almost no district is using yet.
Connecting Trust-Building to Your Enrollment Marketing Calendar
The Parent Trust Pyramid only works if your marketing is showing up at the right layer, at the right time. Here’s how to align your K-12 enrollment management calendar to each trust level:
August – October: Build Awareness
Launch geofencing campaigns near preschools and pediatric offices. Begin short-form video content. Activate Google Business Profile updates. Start showing up where next year’skindergarten families are — 6 months before they think about enrollment.
LEVEL 1 — AWARENESS
November – January: Win Digital Research
Publish parent testimonials, student stories, and program spotlights. Optimize for local SEO. Monitor and respond to online reviews. Make your district the most visible, most credible option when families start their digital deep-dive.
LEVEL 2 — FAMILIARITY
January – March: Convert on Campus
Engineer open houses and tours for emotional impact. Train staff on the 25 trust touchpoints. Share live enrollment data and program outcomes during visits. Use personalized email sequences to follow up within 24 hours of every campus visit.
LEVEL 3 — CONFIDENCE
Year-Round: Retain & Activate
Track engagement signals in your K-12 enrollment dashboard. Run mid-year check-ins with families showing disengagement patterns. Activate your parent ambassador program. Measure referral enrollment as a standalone KPI every quarter.
LEVELS 4 & 5 — PARTNERSHIP & ADVOCACY
Your Trust Pyramid Audit Checklist
- Do you know which zip codes have the lowest awareness of your district? (Enrollment data analysis)
- Is your Google Business Profile updated with photos, hours, and recent posts?
- Do you have parent testimonial video content published in the last 60 days?
- Is your campus tour scripted to hit all 25 emotional trust touchpoints?
- Are you tracking inquiry-to-enrollment conversion rate as a live KPI?
- Do you have an early warning system flagging at-risk families before they transfer?
- Is referral enrollment tracked separately in your student enrollment KPI dashboard?
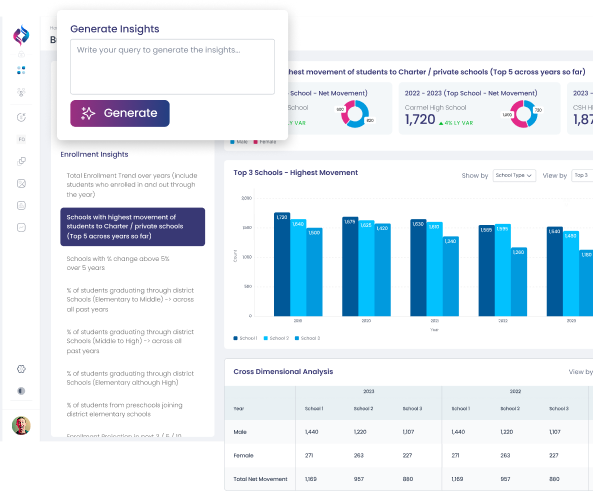
The AI-Powered Enrollment Intelligence Platform
K12Enrollment360 is the premier AI-powered enrollment dashboard designed specifically for school districts. Backed by the k12enrollment360 “Intelligence Layer,” our platform unifies disparate data sources into actionable, executive-friendly insights. By combining advanced analytical solutions with strategic marketing frameworks, K12Enrollment360 empowers superintendents, board members, and communications directors to navigate today’s competitive educational landscape.
We help districts move from traditional outreach to AI-ready enrollment engines, providing the visibility and data-driven tools necessary to drive sustainable student growth and ensure long-term organizational success
Frequently Asked Questions
How is AI being used to identify at-risk students before they disenroll?
AI cross-references attendance patterns, engagement signals, and family communication history to flag students showing early signs of disengagement — weeks before a transfer request is submitted. Districts using early warning systems report being able to intervene proactively, assign a counselor or outreach coordinator, and retain families who would otherwise have quietly left.
Can AI help K-12 districts compete with charter schools for enrollment?
Absolutely. AI-powered enrollment analytics reveals exactly which zip codes and feeder schools are losing students to charters — and why. Districts can use this intelligence to target outreach campaigns, adjust program offerings, and build more compelling messaging for the specific communities where they’re losing ground. Data turns a reactive problem into a strategic one.
What's the difference between enrollment data reporting and enrollment data analytics?
Reporting tells you what happened. Analytics tells you what’s happening — and what’s likely to happen next. Traditional reporting is backward-looking, manually assembled, and typically 30 days behind reality. AI-powered enrollment analytics is live, predictive, and automatically surfaces the trends and anomalies that matter most for district planning.
How does AI improve parent trust and communication in K-12 enrollment?
AI enables districts to personalize parent communication at scale — segmenting outreach by grade band, program interest, and inquiry source rather than sending generic blasts. When families receive relevant, timely information that matches where they are in the decision journey, trust builds faster. AI also helps districts identify which communication channels are actually converting inquiries into enrollments.
Is AI enrollment analytics only useful for large school districts?
Not at all — in fact, smaller and mid-size districts often see the biggest impact. Large districts have dedicated analytics teams; smaller ones typically don’t. AI-powered dashboards give a 500-student district the same data visibility as a 50,000-student one — without needing a data scientist on staff. For resource-constrained districts facing enrollment pressure, this levels the playing field significantly.