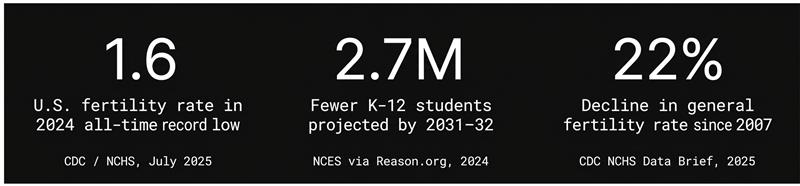
The U.S. fertility rate hit a record low of 1.6 births per woman in 2024 — the 16th consecutive year below replacement level. For school district leaders, this isn’t a distant demographic signal. It’s arriving at your kindergarten door right now, and the pressure will intensify through 2035.
WHY THIS MATTERS NOW
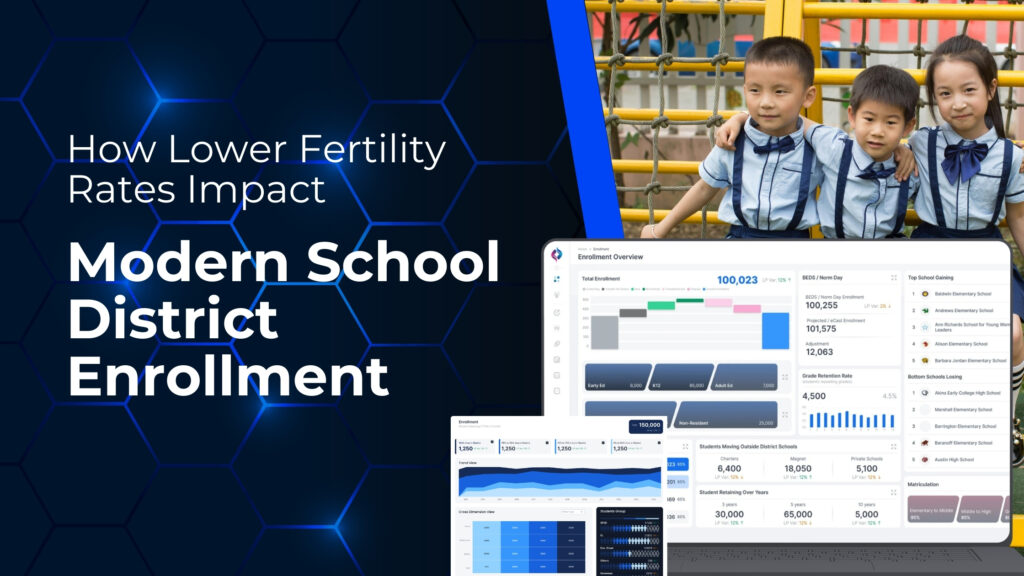
The Demographic Shift District Leaders Can No Longer Plan Around
For decades, U.S. school districts planned for growth. More students meant more funding, more staff, more buildings. That assumption is now structurally broken — and fertility rates are the primary reason why.
The U.S. fertility rate dropped to an all-time low in 2024, with less than 1.6 children per woman — well below the 2.1 replacement rate needed to sustain a stable population. [PBS/CDC, 2025] The CDC’s NCHS confirms the general fertility rate has fallen 22% since 2007. [CDC NCHS Data Brief, July 2025]
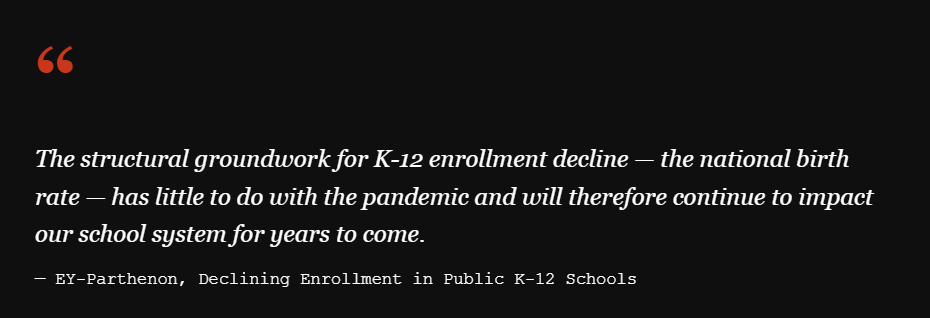
The pipeline from birth to kindergarten takes five years. That means the enrollment pressure your district will face through 2030 is already determined. This is not a forecast. It is a certainty. Brookings Institution projects that the school-age population will decline most sharply between 2025 and 2035, before stabilizing in the 2040s. [Brookings, August 2025]
Here are 8 concrete ways lower fertility rates are reshaping school district enrollment — and what forward-thinking district leaders are doing about each one.
Kindergarten Cohorts Are Getting Smaller Every Year — And It’s Accelerating
The Parents 360 Dilemma:
Modern parents are overwhelmed. When choosing a school, they face a “visibility gap.” If your district’s success stories aren’t front-and-center in their digital search, you don’t exist to them.
The Demographic Shift:
Lower fertility rates have fueled a natural decline in the school-age population. We are no longer in a “growth” market; we are in a “market share” market.
Chronic Absenteeism and Disengagement
Since 2020, the rise of homeschooling and alternative education paths has accelerated. Parents are no longer asking which public school to attend; they are asking if they should attend a traditional school at all.
The most immediate and measurable impact of lower fertility rates lands in kindergarten. Birth rate declines flow directly into enrollment declines exactly five years later making kindergarten enrollment your most reliable leading indicator of district-wide K-12 enrollment management challenges ahead. NCES projects K-12 enrollment will drop by another 2.7 million students by the 2031–32 school year, with states like California, New York, and New Mexico projected to lose more than 10% of their student population. [Reason.org / NCES, 2024] Districts that are tracking kindergarten enrollment trends in real time, not just annually, are the ones that have the runway responded to.
Per-Pupil Funding Loss Is Compounding Faster Than Boards Anticipate
Every student who doesn’t enroll is a student who takes per-pupil funding with them. Broward County, Florida lost $342 million in funding over a decade as enrollment fell 17%. [K-12 Dive, Jan 2026] McKinsey’s K-12 research confirms per-pupil spending could remain flat in nominal terms through 2026–27 while real purchasing power shrinks. [McKinsey, Sep 2025] For district finance leaders, fertility-driven enrollment decline isn’t a future problem — it’s a present budget crisis in slow motion. Accurate school district enrollment reporting tied to multi-year financial modeling is now a fiscal survival tool, not a planning nicety.
Regional Enrollment Decline Is Deeply Uneven — Some Districts Are Growing
Fertility-driven decline does not hit every district equally. PPIC research shows western states face the steepest projected declines — up to 10% — while the South may see enrollment remain roughly constant or even grow. [PPIC, 2023] Within states, suburban districts attracting young families are sometimes growing while neighboring districts shrink. Predictive enrollment analytics for school districts that layer birth rate data with housing development trends and migration patterns give superintendents a geographically granular picture — identifying which schools face pressure and which have growth opportunity, years in advance.
Staffing Ratios Are Breaking Down in Unexpected Ways
As kindergarten cohorts shrink, the ripple effect travels grade by grade over the following decade. A district that loses 50 kindergarteners this year will have 50 fewer first graders next year, compounding across every staffing, budgeting, and facility decision. Alabama’s state superintendent has already projected the need for 500 to 700 fewer teachers by 2026–27 — driven directly by enrollment decline. [K-12 Dive, Nov 2025] A real-time K-12 enrollment dashboard that tracks enrollment by grade band and projects staffing ratios three to five years forward turns this challenge from a reactive crisis into a managed transition.
School Consolidation Decisions Are Now Being Made on Incomplete Data
As enrollment falls, districts face increasingly difficult decisions about school closures and consolidations. AASA research is explicit: “Avoiding that uncomfortable position requires frequent monitoring” and the ability to see problems coming from further away. [AASA, 2025] Yet most school closure decisions are being made with enrollment data that is months old, manually compiled, and missing the geographic nuance needed to make sound long-term calls. Houston ISD closed 12 schools in February 2026. Corpus Christi ISD closed seven. [K-12 Dive, 2026] Enrollment data visualization for schools that layers capacity utilization, demographic projections, and community impact data is no longer optional — it’s the foundation of defensible, community-supported decisions.
Immigrant Fertility Decline Is Removing a Buffer Many Districts Relied On
For years, immigration and higher immigrant birth rates partially offset fertility decline in many urban districts. That buffer is eroding. In 2019, immigrant fertility rates dropped below replacement levels for the first time in U.S. history. [Reason.org, 2024] Combined with increased federal immigration enforcement cited by several districts as a direct enrollment factor, [K-12 Dive, 2026] the demographic assumptions underlying many urban enrollment projections need to be revisited. A student enrollment KPI dashboard that tracks demographic composition changes in real time — not just total headcount — gives district leaders the nuanced picture they need to plan accurately
Districts Must Now Compete for a Shrinking Pool of Students
Lower fertility rates don’t just reduce enrollment — they intensify competition for the students who do exist. With 40% of all U.S. students now eligible for private school choice programs, school choice expansion has dramatically amplified the impact of demographic decline for public districts. [EdChoice via Reason.org, 2024] A smaller birth cohort distributed across more school options means public districts are competing harder for a population that is simultaneously shrinking. K-12 enrollment analytics that tracks school choice leakage by zip code and feeder school — identifying which competitor schools are drawing your families — moves this from an anecdotal concern to a data-driven strategy problem that can be addressed.
Long-Range Planning Requires a New Kind of Enrollment Intelligence
The districts navigating this era most effectively share a common data posture: they have moved from annual enrollment snapshots to continuous, predictive intelligence. Brookings Institution projects that the school-age population decline will be most severe between 2025 and 2035 before stabilizing. [Brookings, Aug 2025] That decade-long window is a planning horizon — not a crisis to react to. Enrollment data insights for superintendents that integrate birth rate trends, housing development data, migration patterns, and school choice activity give district leaders the foresight to right-size facilities, realign staffing, redesign programs, and retain families — before the pressure becomes irreversible.
KEY TAKEAWAY FOR DISTRICT LEADERS
Fertility-driven enrollment decline operates on a fixed five-year lag — births today become kindergarteners in five years. This means the enrollment environment through 2030 is already determined by births that have already occurred. The question for every superintendent is no longer whether this will affect their district. It is whether they can see it clearly enough to act before it becomes a fiscal emergency.
What District Leaders Are Doing Right Now
The most forward-thinking districts responding to fertility-driven enrollment decline are making three fundamental shifts in how they operate:
From annual reporting to real-time enrollment tracking.
Static reports assembled quarterly can no longer support the pace of decisions districts face. Live K-12 enrollment dashboards that surface grade-level trends, geographic patterns, and school choice activity as they happen give leaders a meaningful window to intervene.
From reactive closures to proactive planning.
AASA’s research is consistent: districts that see problems coming “from further away” buy themselves time and community goodwill that districts reacting to crisis do not have. [AASA NCE, 2025] Enrollment trend analysis tied to long- range demographic modeling is the difference between a managed consolidation and a community crisis.
A data-driven strategy allows you to meet parents where they are. For a family in the “Evaluation” phase, a generic “Register Now” email is useless. They need “Social Proof”—testimonials from other parents and data on student outcomes. Dashboards let you segment your audience so you can send the right message to the right family at the exact right moment.
From passive enrollment to active enrollment marketing.
In a shrinking market, enrollment is no longer automatic. Districts that are growing in declining demographic environments are investing in parent outreach, digital visibility, and community trust — treating enrollment as a discipline that requires strategy, measurement, and consistent execution.
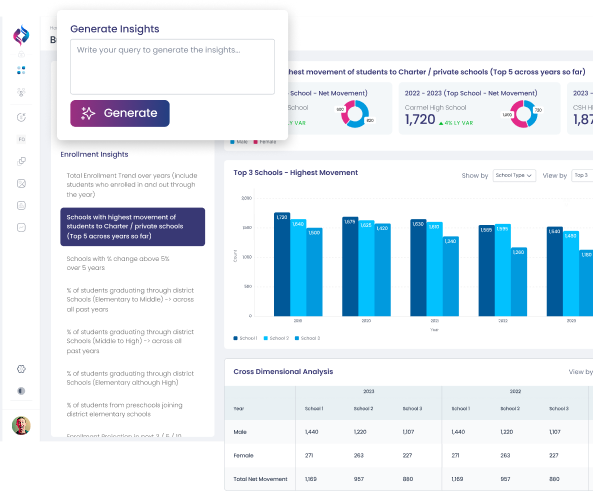
The AI-Powered Enrollment Intelligence Platform
K12Enrollment360 is the premier AI-powered enrollment dashboard designed specifically for school districts. Backed by the k12enrollment360 “Intelligence Layer,” our platform unifies disparate data sources into actionable, executive-friendly insights. By combining advanced analytical solutions with strategic marketing frameworks, K12Enrollment360 empowers superintendents, board members, and communications directors to navigate today’s competitive educational landscape.
We help districts move from traditional outreach to AI-ready enrollment engines, providing the visibility and data-driven tools necessary to drive sustainable student growth and ensure long-term organizational success.
Frequently Asked Questions
How do falling birth rates directly affect K-12 school district enrollment numbers?
Falling birth rates reduce the size of each incoming kindergarten cohort five years after the decline occurs. Since most state funding formulas are tied to per-pupil enrollment, smaller cohorts mean less revenue — year after year, grade by grade. Districts that don’t see this coming in their enrollment data analytics have limited time to adjust staffing, budgets, and facilities before the fiscal pressure becomes acute.
Which U.S. regions are most at risk from fertility-driven enrollment decline?
Western and Northeastern states face the steepest projected declines — up to 10% — according to PPIC research, with California alone projected to fall to 1990s enrollment levels by 2031. Southern states are relatively more stable. However, even within stable regions, individual districts can experience sharp declines depending on local housing trends, migration patterns, and school choice competition. Enrollment trend analysis at the district and zip-code level is the only way to know your specific exposure.
Is there anything school districts can do to counteract enrollment loss from lower birth rates?
Districts cannot change the birth rate — but they can compete more aggressively for the students who do exist. This means investing in enrollment marketing, strengthening parent trust, expanding program differentiation, and using predictive enrollment analytics to identify and retain at-risk families before they transfer. Districts that treat enrollment as a strategic discipline — not just an administrative function — consistently outperform peers in the same demographic environment.
How far in advance should districts be planning for fertility-driven enrollment changes?
At minimum, five to seven years — the time it takes for a birth cohort to reach kindergarten and produce measurable enrollment impact. Brookings Institution projects the most severe school-age population decline will occur between 2025 and 2035, meaning the pressure is already baked in for the next decade. Superintendents using predictive enrollment analytics tied to local birth rate and housing data can build rolling 10-year enrollment forecasts that inform facility, staffing, and program decisions well ahead of the crisis point.
How does a K-12 enrollment dashboard help districts respond to fertility-driven decline?
A real-time K-12 enrollment dashboard gives district leaders a live picture of kindergarten cohort sizes, grade-level enrollment trends, mid-year mobility rates, and school choice leakage — all in one place. Instead of discovering a decline in the quarterly report, leaders see it forming in real time and have the window to act. When enrollment data is connected to budget modeling and staffing projections, the dashboard becomes a full district planning tool — not just a reporting mechanism.
Take the Next Step
Ready to see what your district’s enrollment data is telling you right now?